

Collect Windows10 Events in log analytic Workspace
Contributor of System Center Dudes. Based in Montreal, Canada, Senior Microsoft SCCM consultant, working in the industry for more than 10 years. He developed a strong knowledge of SCCM and MDT to build automated OS deployment solution for clients, managed large and complexe environment, including Point of Sale (POS) related projects.

Jonathan Lefebvre
Table of Content


Share


Get the latest insights and exclusive content delivered to your inbox
Windows 10, Azure, and Endpoint Manager offer many different tools to gather and know more about what is going on in your environment. One of those is Log Analytics Workspace. Log Analytics workspace has the ability to collect data from Windows devices such as Events and performance data through the Microsoft monitoring agent. This can centralize Windows events to be analyzed and crunched to identify potential impacts happening to many computers.
While the Monitoring agent is free, the data hosted in Log Analytics Workspaces will cost a little per month for great insight. Based on past experience, you can expect ~100$/month for roughly 7000 devices reporting Errors and Warning.
In this post, we will describe how to configure the Azure Log Analytics Workspace to gather Windows10 Events centrally.
Windows10 Events log analytic – Prerequisites
- The following operating systems are supported to report event viewer by using the Log Analytics agent
- Windows 7, 8 and 10
- Windows Server 2008 SP2 and above
- Clients communicate to the Azure Monitor service over TCP 443
For mode details about the requirements, see Microsoft Docs
Create a Log Analytics Workspace
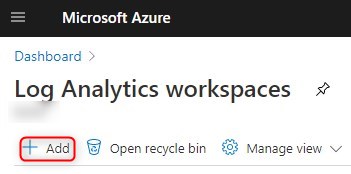
- Open the Azure portal and search for Log Analytics Workspaces
- Click on Add
- Select the subscription that the usage of Log Analytics Workspaces will be billed to. Specify a name for the instance name and select the region that it will be hosted to
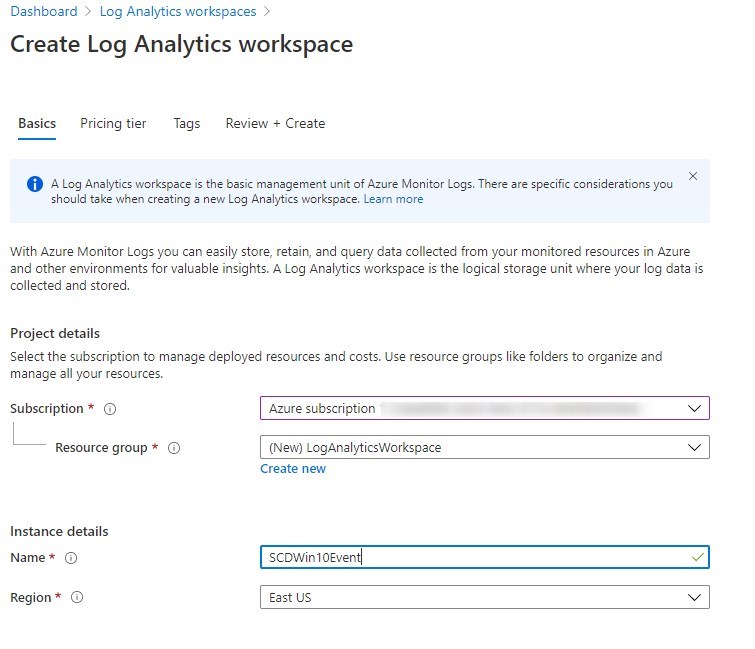
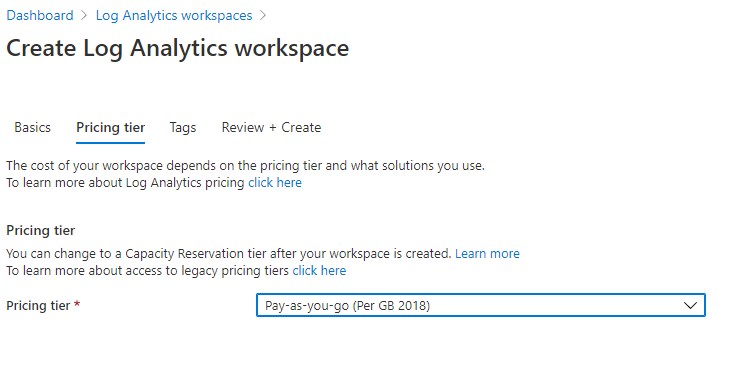
- Select the Pricing tier. This will vary depending on your contract with Microsoft.
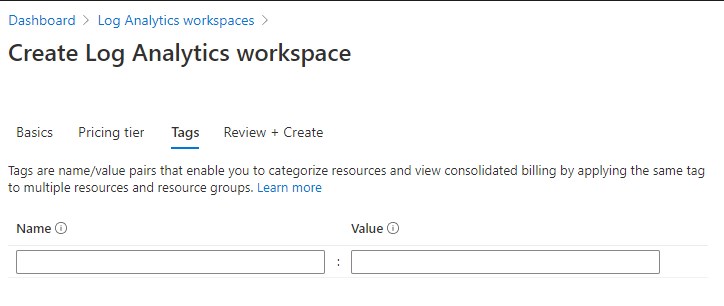
- Specify Tags if you wish so.
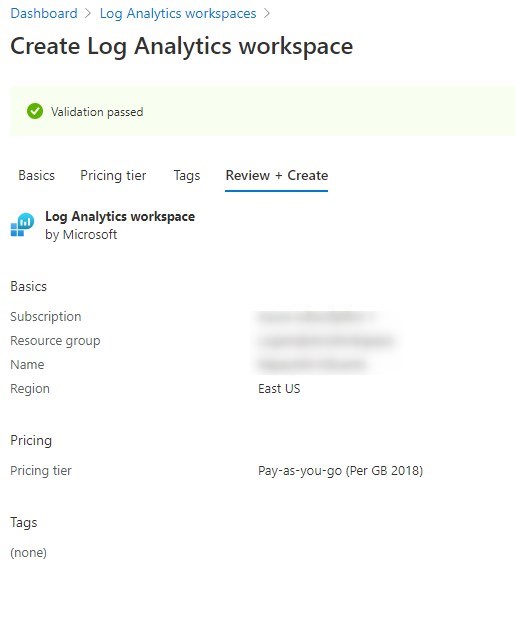
- Review final validation and create the Log Analytics workspace
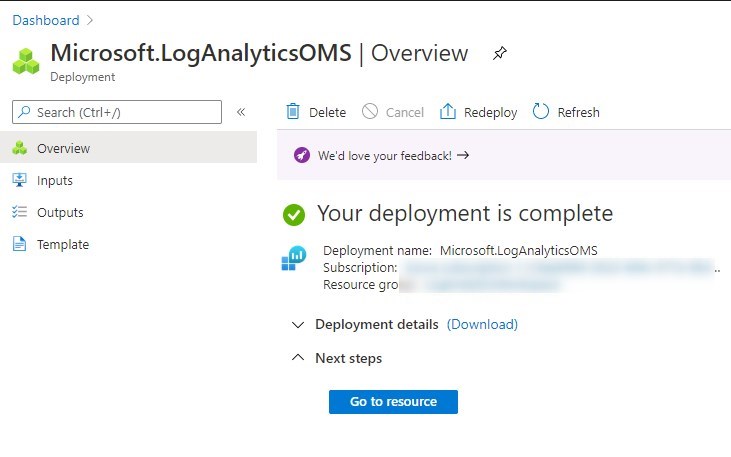
- The Log Analytics workspace will be created within seconds.
Configuring Windows Event logs
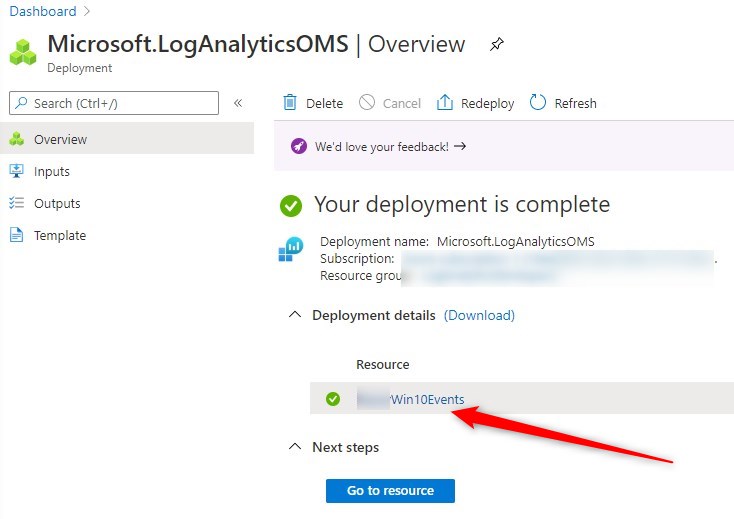
- From the overview page of the newly created Log Analytics Workspaces, select the Resource just created
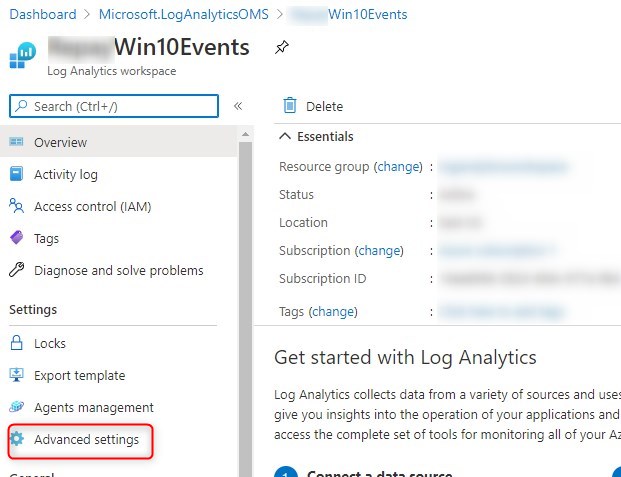
- Select Advanced Settings
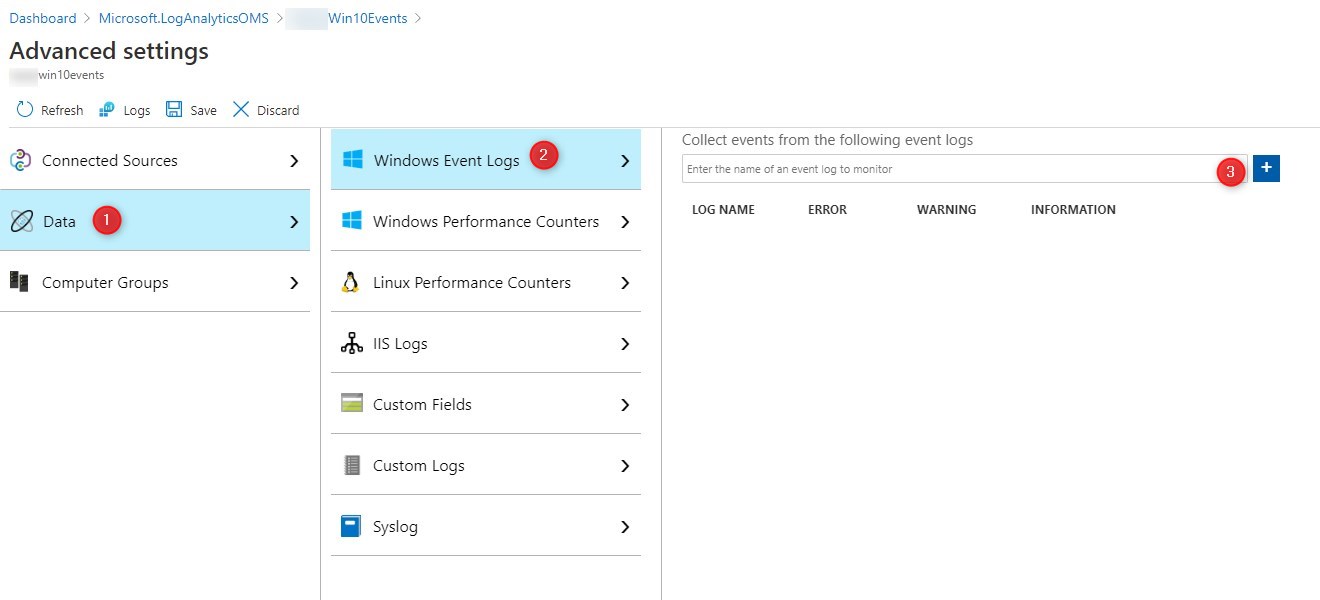
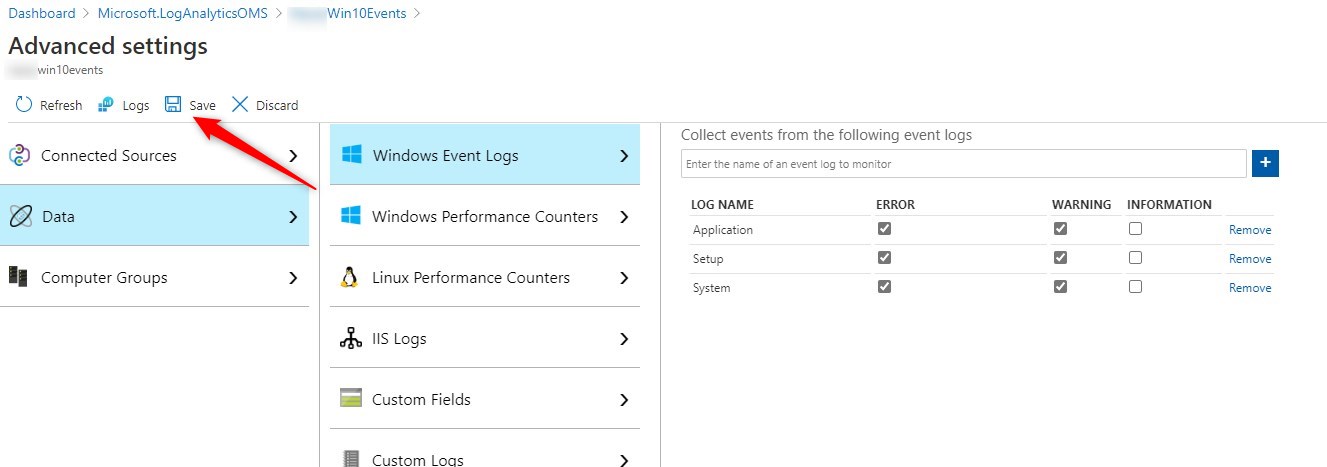
- Under Data/Windows Event Logs, we need to add the events we wish to collect.
- Simply type in the Events you wish to monitor, for example System, Application or Setup.
In most cases, avoid selecting Information since there are way too many information events generated per computer. This would have an impact on the cost associated with Log Analytics Workspace.
For some more specific event categories, Information may make sense, depending on what you are looking for.
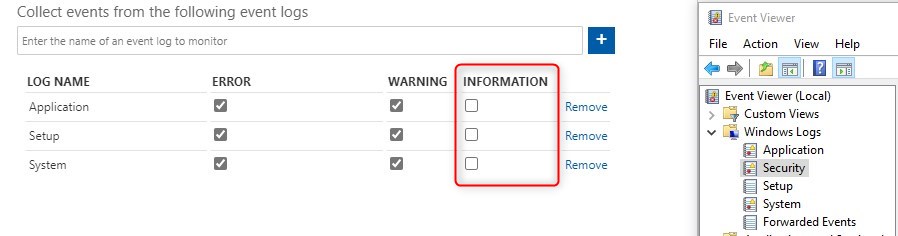
- Once the list is completed, click Save
Download the Monitoring Agent
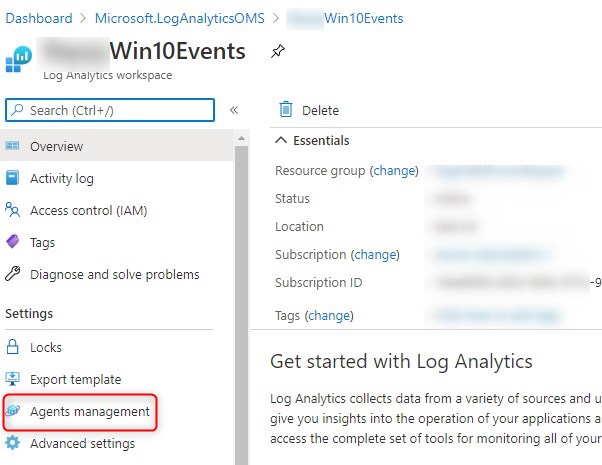
- In the workspace details, select Agent Management
- Download the Windows Agent based on the OS architecture needed
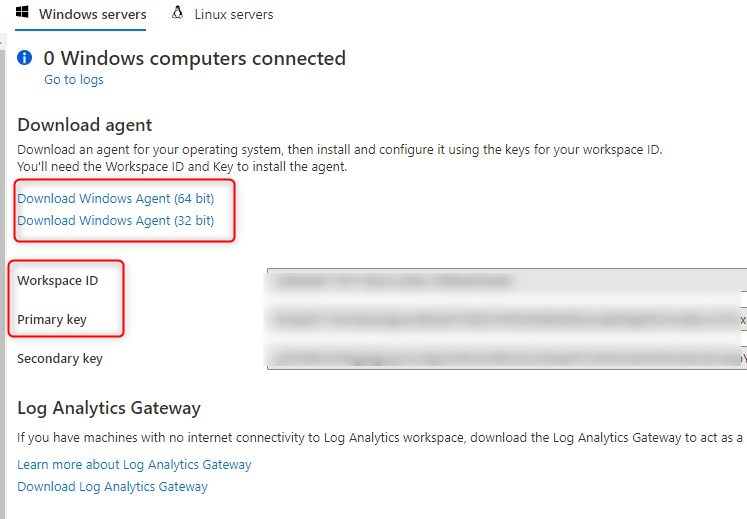
- Take note of the Workspace ID and Primary Key. They both will be required at the install time.
If some computers do not have direct internet connection, and you still need to have events centralized, it is possible to configure a Log Analytics Gateway.
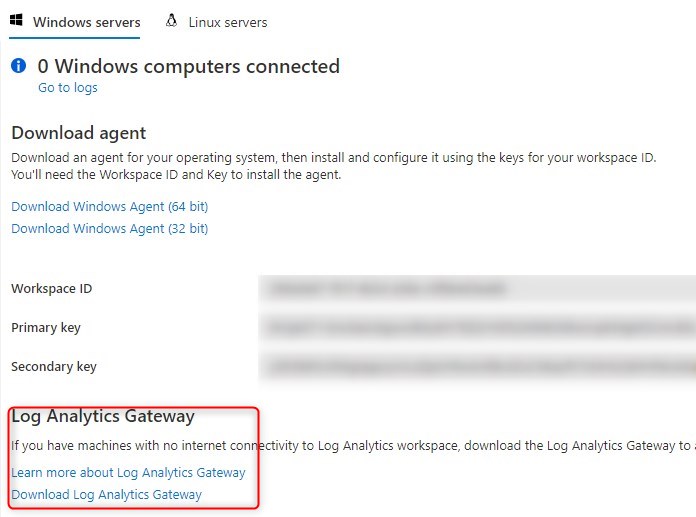
See Microsoft docs for more details
Install the Monitoring agent
The Monitoring agent can be installed manually or silently using an install command. Endpoint Manager or Configuration Manager can easily deploy this agent with the command line.
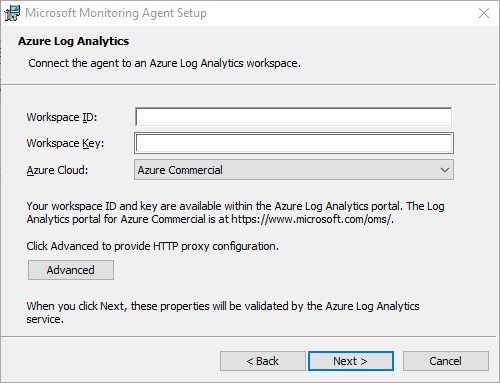
- When ran manually, the Workspace ID and Primary key will be asked within the install wizard
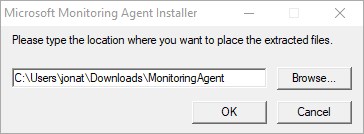
- To create a silent install, the setup.exe must first be extracted from the downloaded installer
- From a command prompt, use the following command to extract the content
- MMASetup-AMD64.exe /c
- a prompt will show to set the location
- The silent install command line should look like this
setup.exe /qn NOAPM=1 ADD_OPINSIGHTS_WORKSPACE=1 OPINSIGHTS_WORKSPACE_AZURE_CLOUD_TYPE=0 OPINSIGHTS_WORKSPACE_ID="<WorkspaceID>" OPINSIGHTS_WORKSPACE_KEY="<Workspace Key>" AcceptEndUserLicenseAgreement=1- Workspace ID and Workspace Key need to be specified.
For more details about the installation of the Monitoring agent, see Microsoft docs
Verify Agent communication
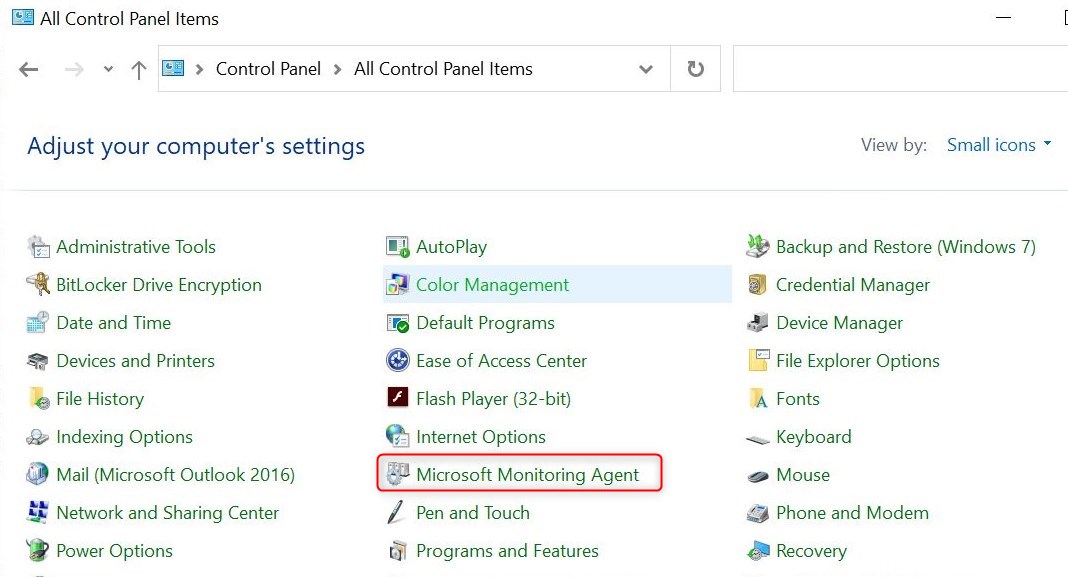
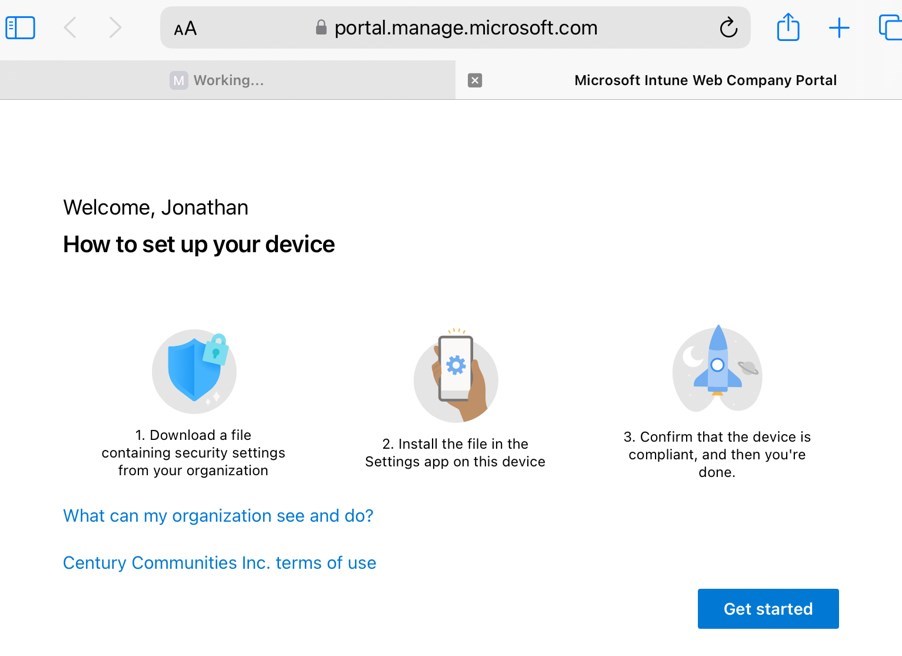
- On a computer that the Monitoring agent is installed, go to Control Panel, and select Microsoft Monitoring Agent
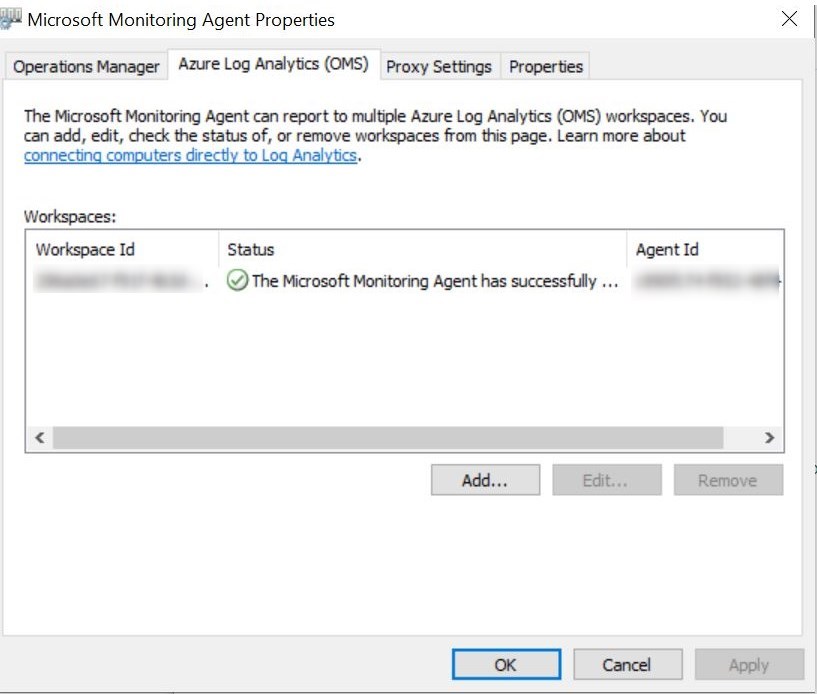
- On the tab Azure Log Analytics, the status of the agent is reported.
- After a few hours, the events will be available in Log Analytics workspaces.
How to view centralized Windows events
- In the Log Analytics Workspace, select Logs
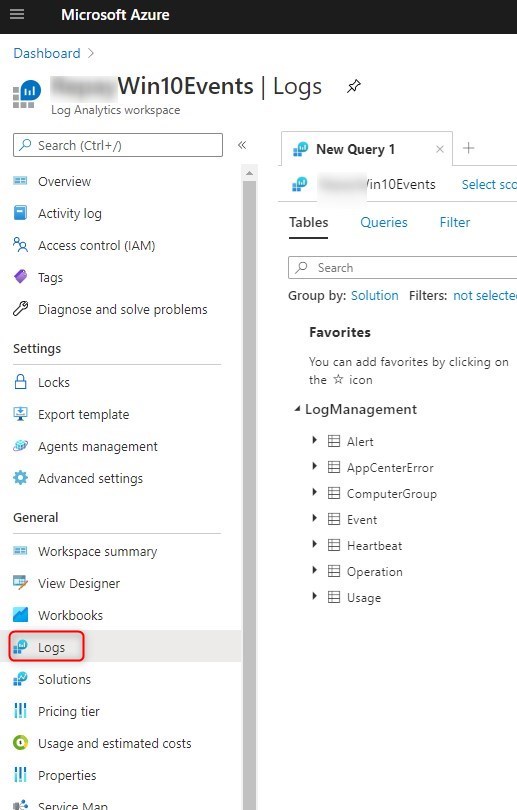
- From there, queries can be made. While the query language isn’t intuitive, after a few queries, details can be sorted about the Windows events happening in your environment.
For more details about Log Analytics query language, see Microsoft Docs
Log Analytics query examples
Here’s a few example of queries for Windows10 Events log analytic
To list all events for a specific computer
Event | where Computer == "<computer name>"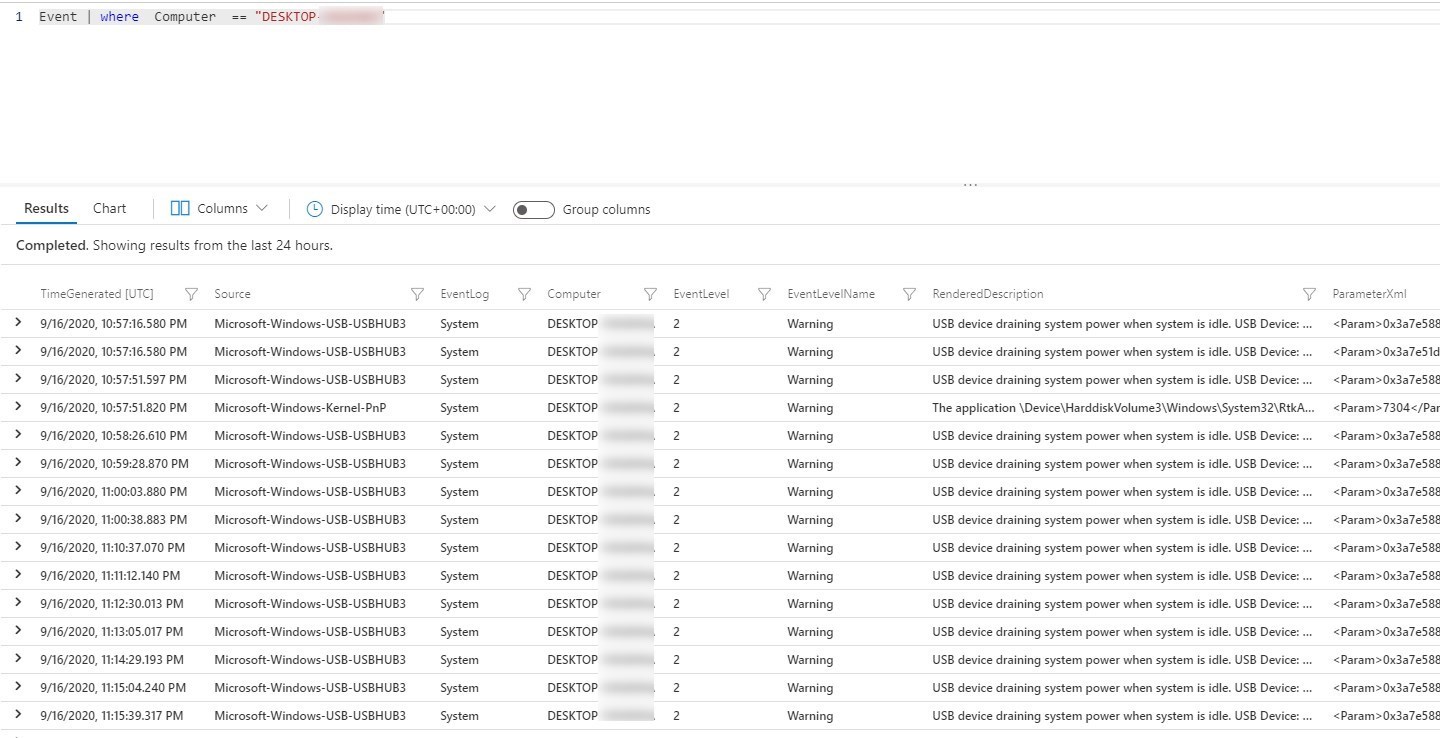
To list all events returned by all computers
Event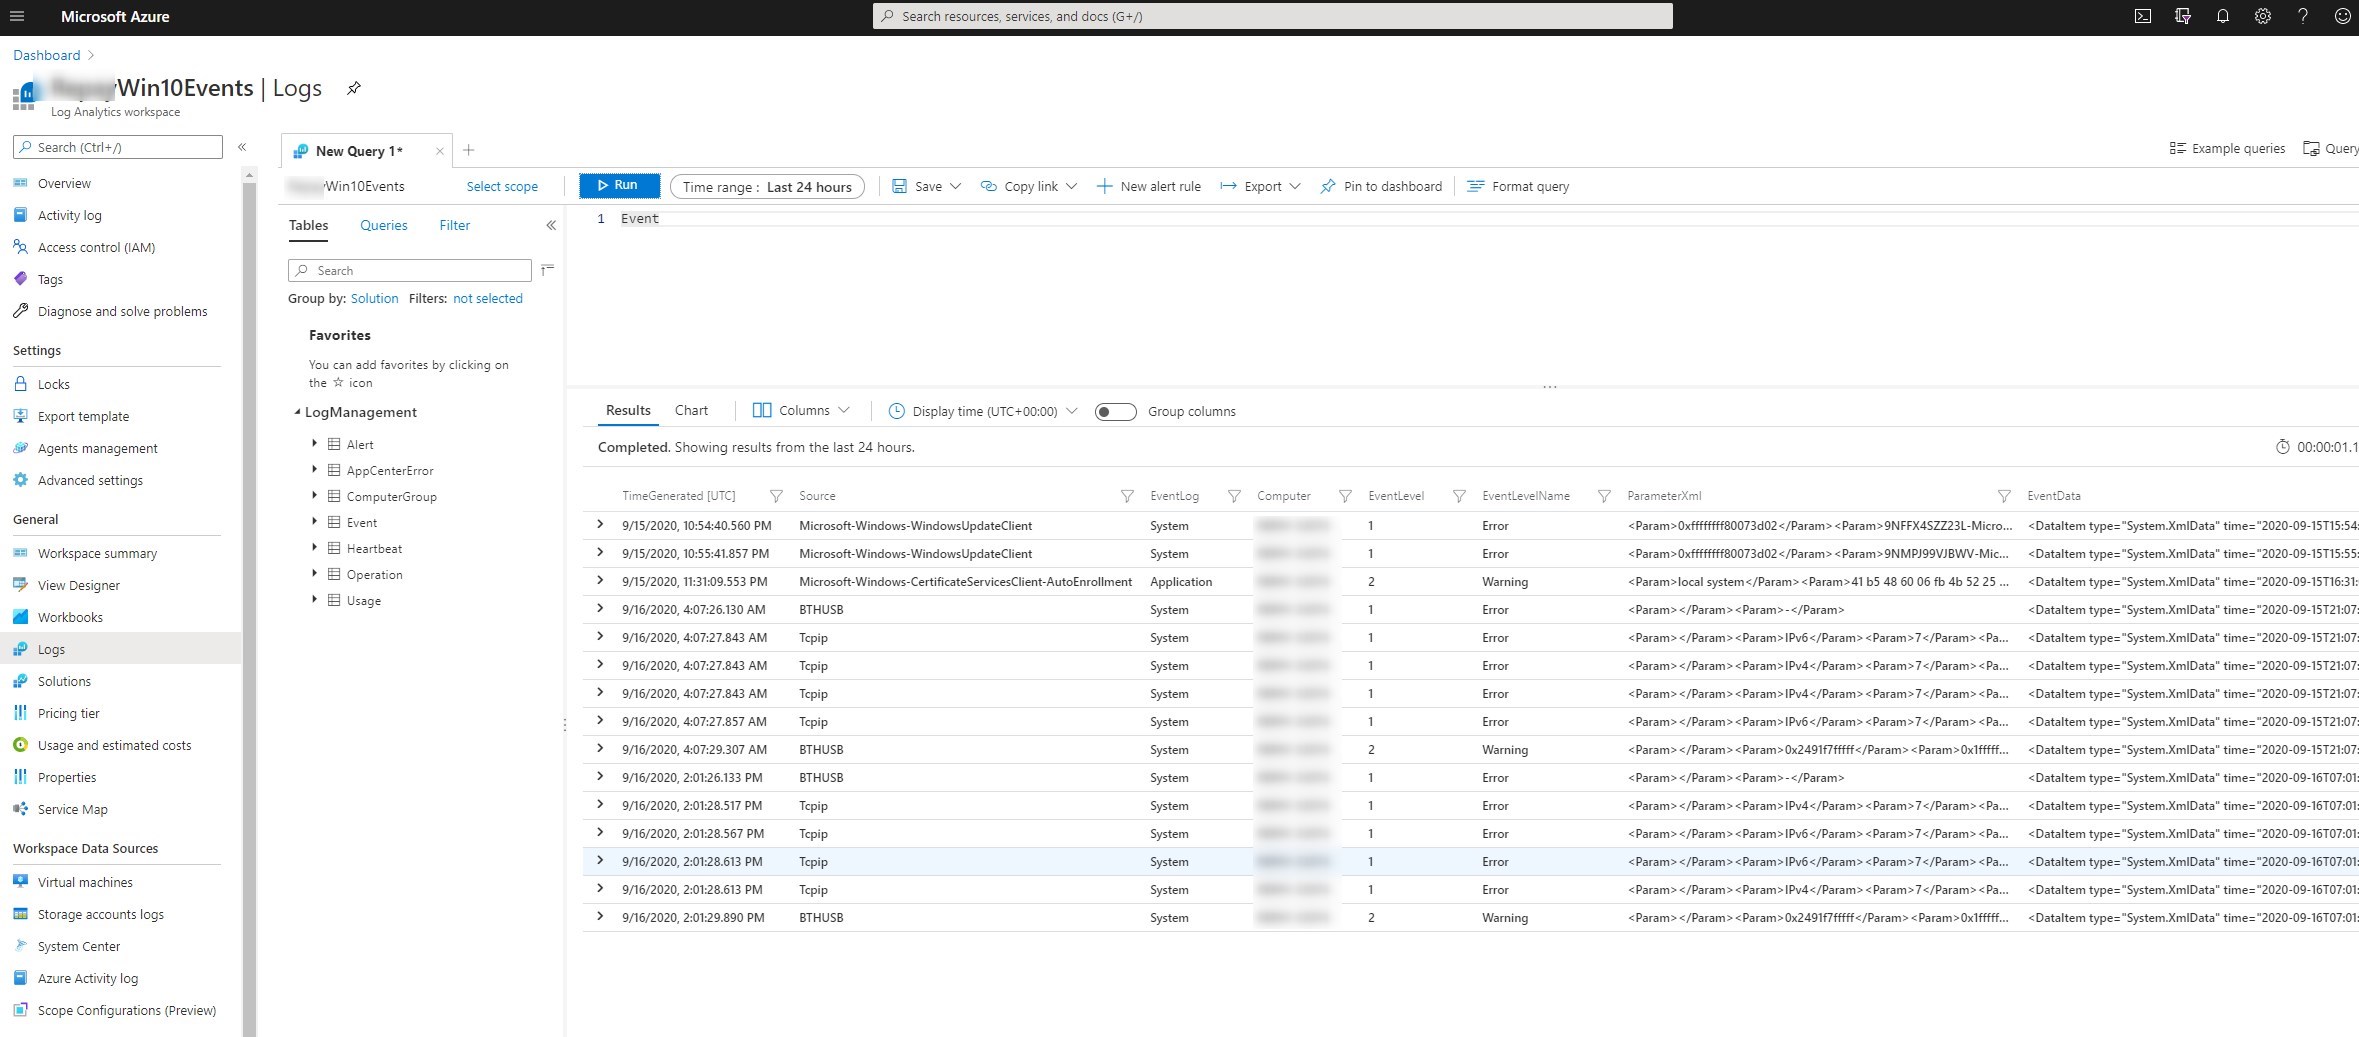
To list counts of Errors in the System events
Event | where EventLog == "System" | where EventLevelName == "Error" | summarize count() by Source, EventID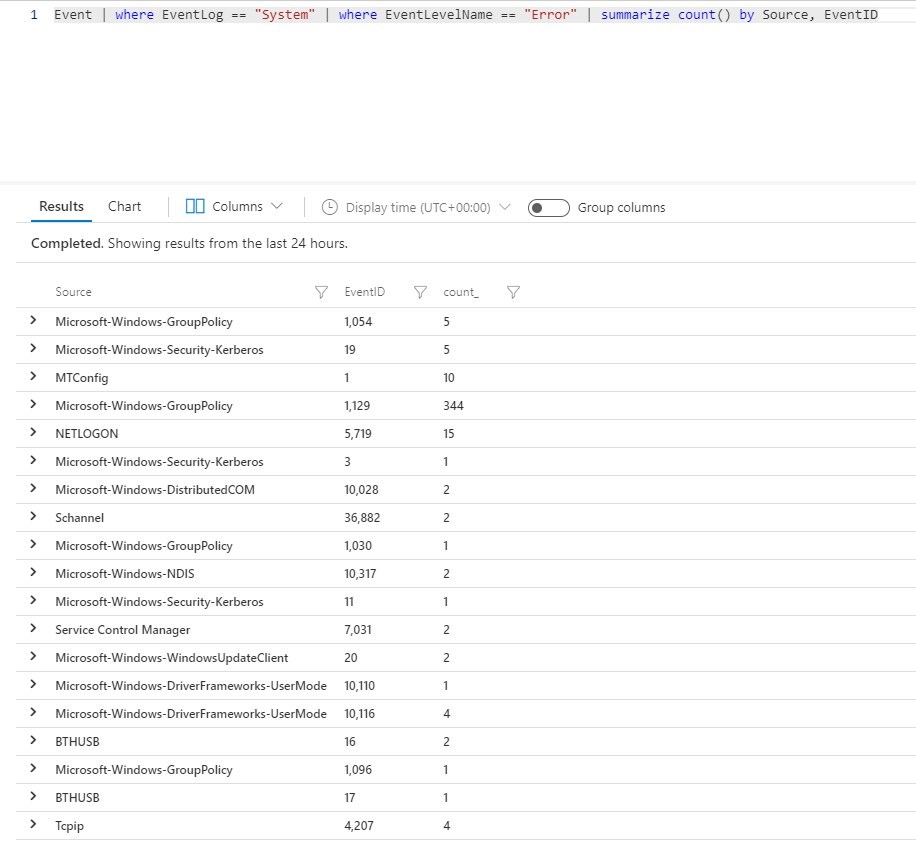
Counts of specific event ID per computers
Event | where EventID == 5002 and EventLevelName == "Error" | summarize Event_Count=count() by Computer | sort by Event_Count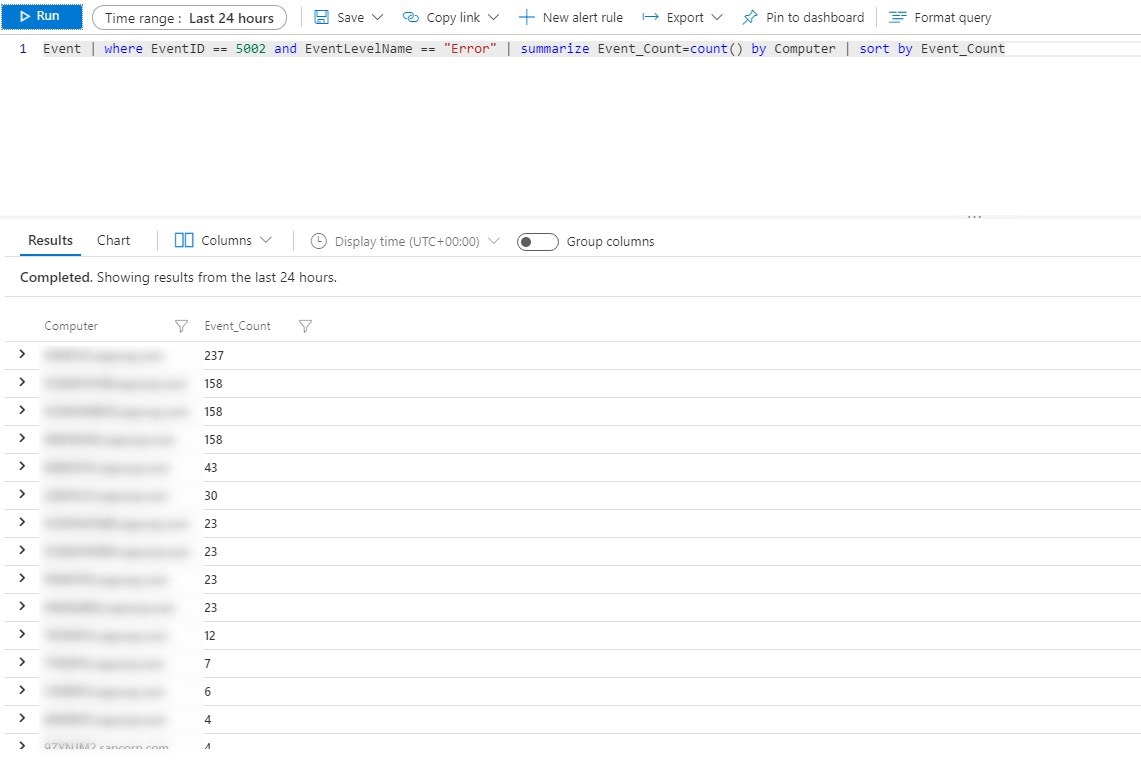
Counts of errors per day for all computers
Notice that you can use chart for easily pinpoint bad days. It is also possible to modify the Time Range for bigger overview. In the below example, digging what happened on September 9th would make sense since the number of errors globally was way higher then usual.
Event | where EventLog == "System" | where EventLevelName == "Error" | summarize events_count=count() by startofday(TimeGenerated) | sort by TimeGenerated asc nulls last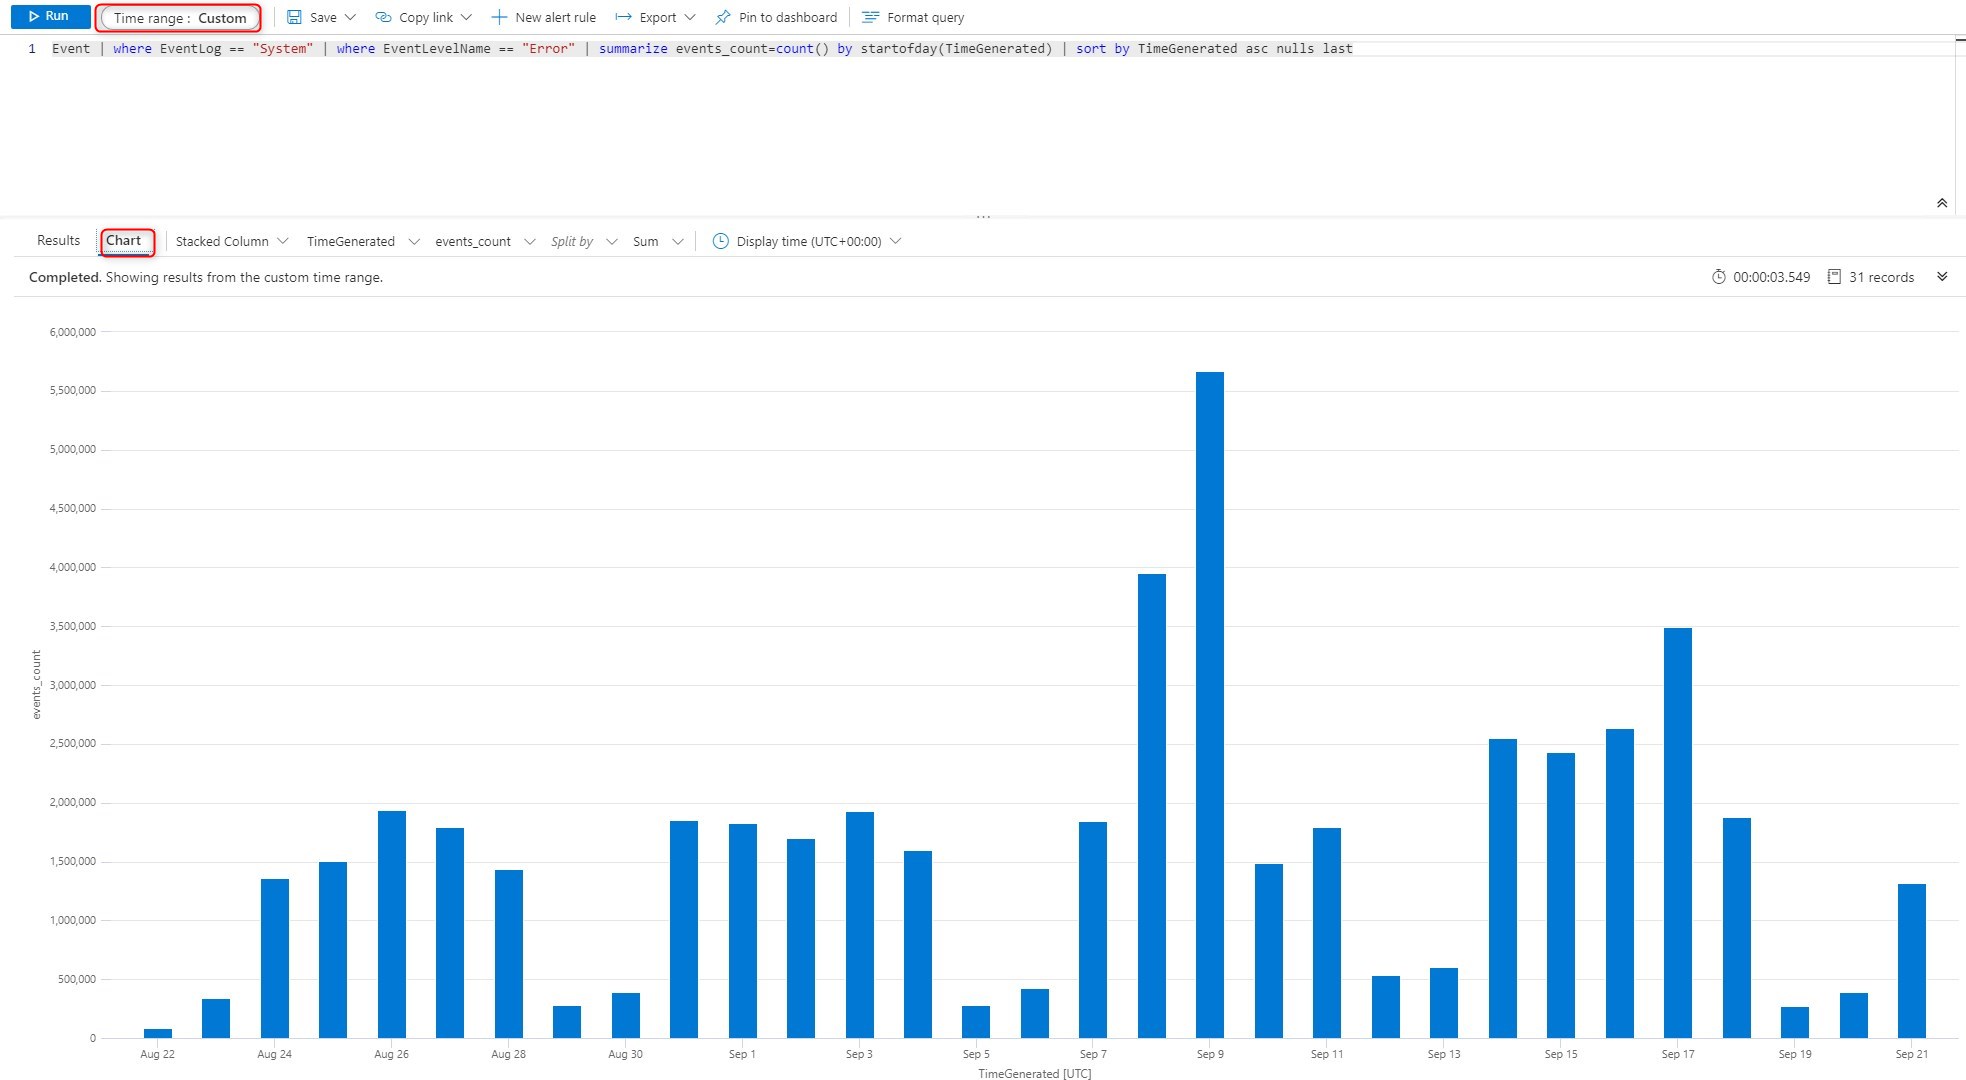
For more details about Log analytics agent, see Microsoft docs
Share
Get the latest insights and exclusive content delivered to your inbox


Only authorized users can leave comments
Log In