
Since SCCM 1706, you can run and deploy Powershell scripts from the SCCM console basically in real-time. From the SCCM console, you can: edit your scripts, import existing scripts, approved or deny scripts, run scripts on specific collections and examine scripts results. This can be useful to run a script quickly without the burden of creating a package or an application. Unlike standard deployments, when you deploy scripts, they are run almost immediately using Client Operations.
Before SCCM 2006, the SCCM Script needs to be enabled in the optional features. If you are running a later version, it’s enabled by default.
If you need to know more about how to use this feature, we have a complete blog post describing that. This blog post will focus on the SCCM Scripts monitoring, the execution statistics and output. We’ll describe how you can effectively monitor who in your organization is creating, approving and deploying scripts. We’ll also show various methods to verify that your script runs correctly on your devices.
For this blog post, we were running SCCM 2107. If you’re not seeing the same result, update to the latest SCCM version.
Monitor Script from the console
After you created and deploying your script, the first thing you’ll want to know is if it has run successfully on your devices. To check that there’s a couple of option. The first one would be to use the SCCM Console
- Open the SCCM Console
- Go to Monitoring / Script Status
- From there, you have some information about your deployment in the right pane :
- The script name
- The collection on which it has been deployed
- The Overall Script Execution State
- Overall script completion statistic.
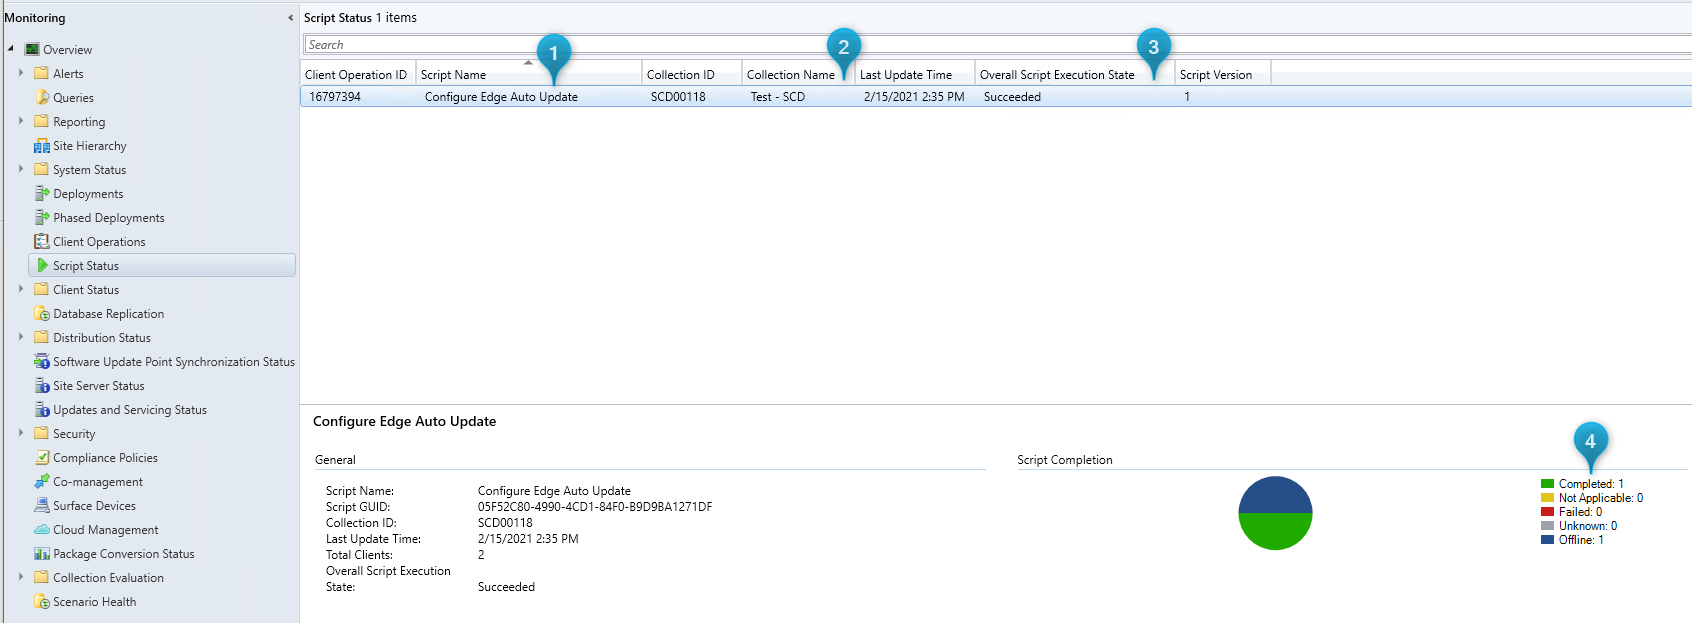
Unfortunately, it’s impossible from this screen to have detailed statistics. Maybe you’ll want to know which device has run the script without error or you’ll want to have a list of machine that has failed.
To see detailed information, you need to execute these steps :
- Right-click on the desired script and select show status

- A new windows wil pop out.
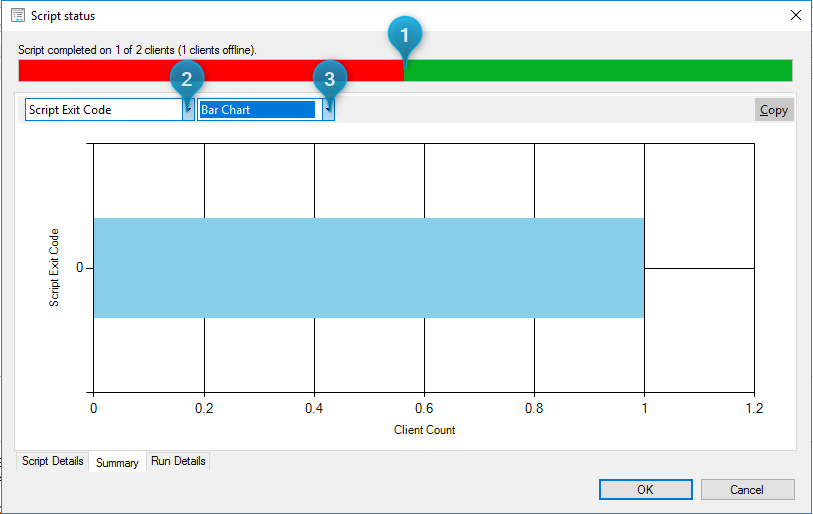
- In the Summary tab
- At the top, the red/green bar shows statistics about the execution
- You can select to see result based on script output or exit code
- You can select which type of chart you want to see (Bar, Donut or Data table)
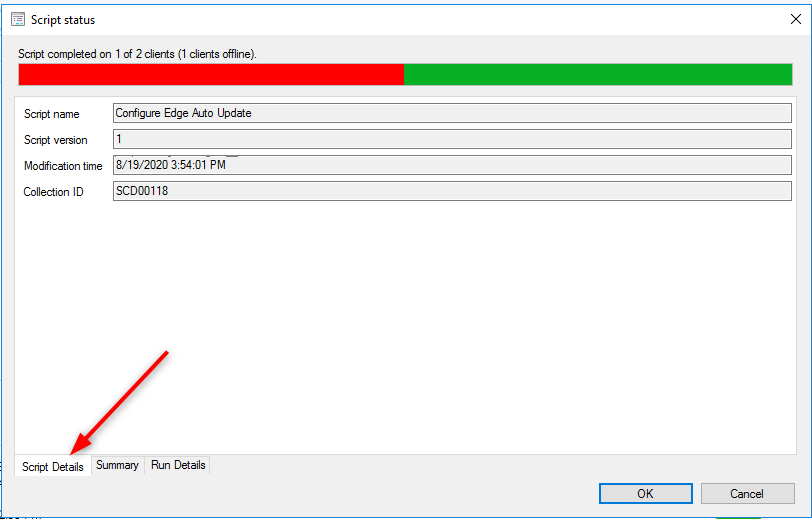
- At the bottom you can click on Script detail to have more informations
- At the bottom you can click on Run detail to have information about the deployment and see per machine
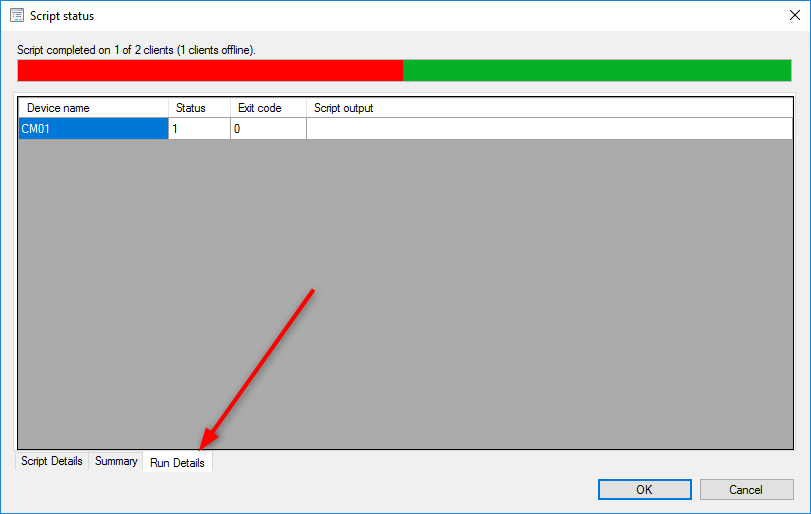
Other than that, there’s not much more information to monitor your script. It’s impossible to have an overview of your author, approval and such.
Monitor SCCM Script using a custom report
We decided to build 2 report to ease the script monitoring.
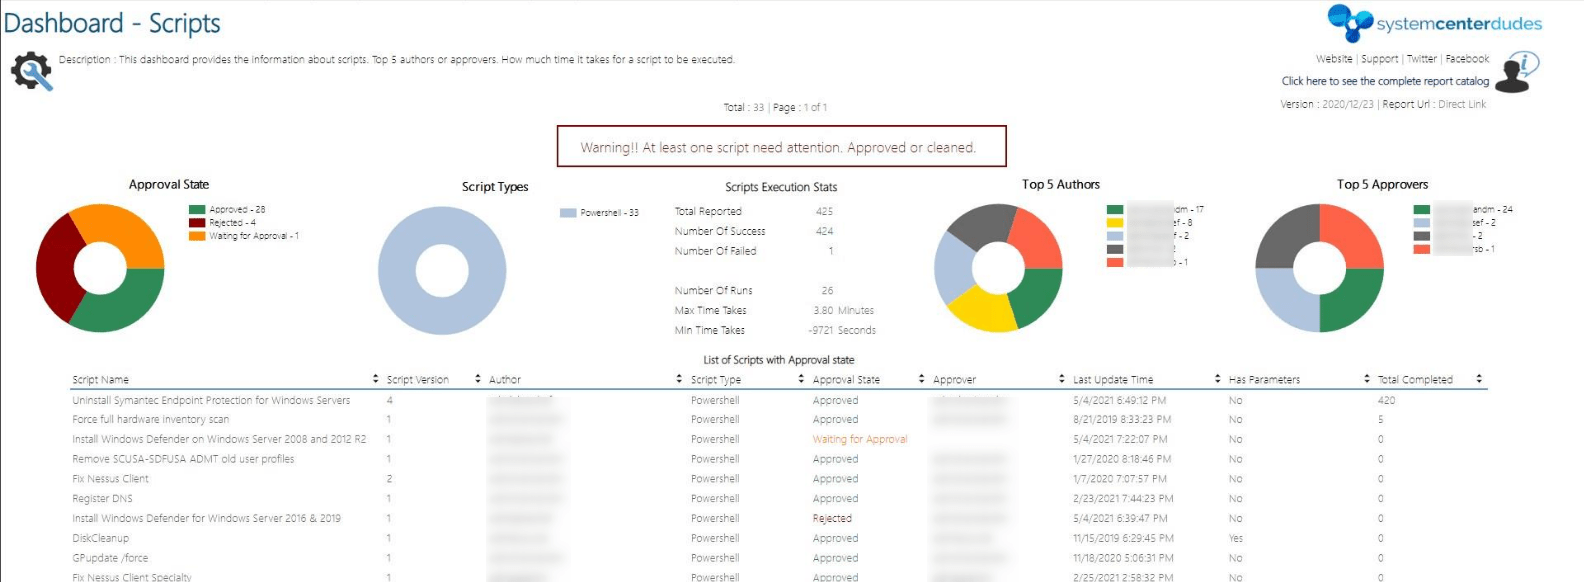
In the first report, you can see 5 detailed pie charts about :
- Approval State
- Script type
- Statistics on script execution time
- Top 5 Authors
- Top 5 Approver
At the bottom, all your script and their details about approval status and execution statistics, all in a single place. This is very useful if you are using SCCM scripts a lot.

- If you click a script name, it brings you to the second report which shows execution statistics per machine on the selected script:
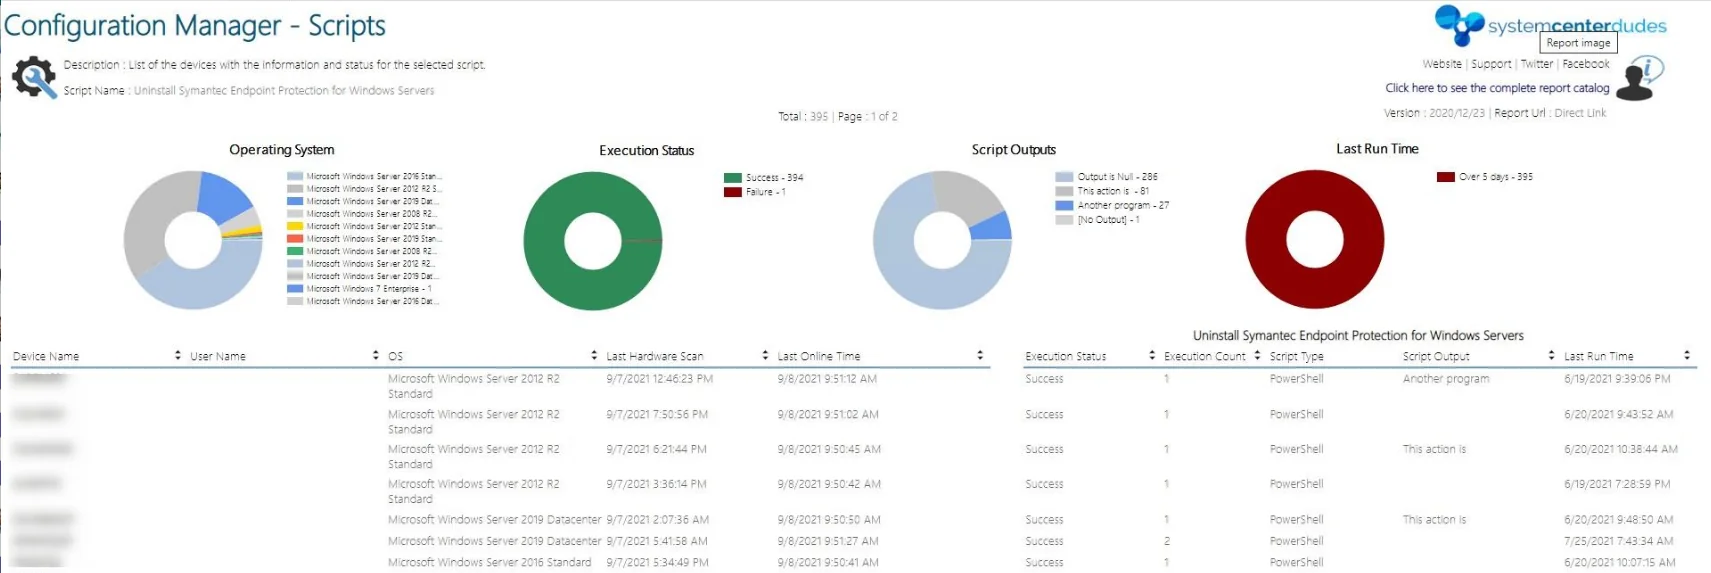
So there you have it ! If you are a heavy script organization, we strongly suggest that you look at the SCCM Script report option.
This report is available in our shop. Let us know your comment or suggestion to improve the product.






Only authorized users can leave comments
Log In